Outbound Dashboard - Monitor Campaign Performance and Channel Metrics in ConvyAI
Overview
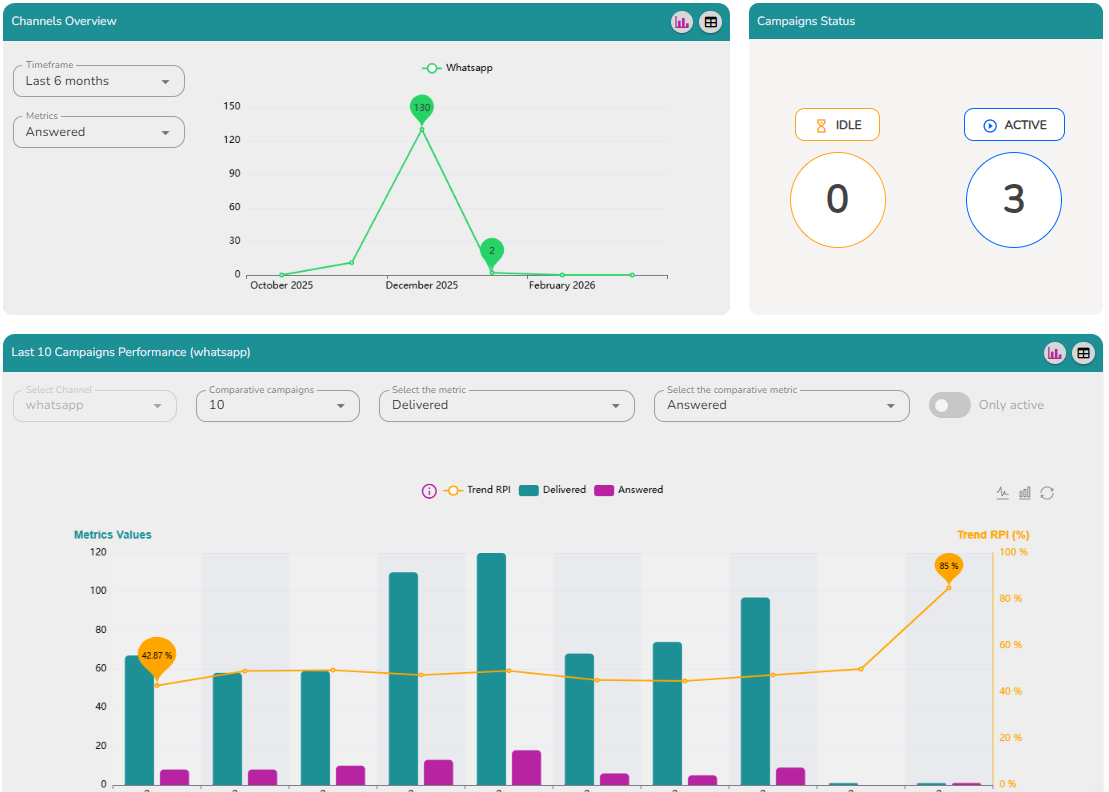
The Outbound Dashboard provides a comprehensive view of campaign performance and status. It features three primary widgets for monitoring and analysis, with export options for detailed data review.
Navigate to Outbound → Dashboard.
Channels Overview
The Channels Overview widget displays aggregated metrics by channel, offering insights into each channel's performance over a selected time period.
Use the time frame selector to choose between:
- Current month
- Last 3 months
- Last 6 months
You can also select specific metrics to visualize, providing flexibility in assessing key performance indicators.
Campaign Status
The Campaign Status widget shows the count of active and idle campaigns, enabling a quick assessment of campaign statuses at any given moment.
Campaigns Performance
The Campaigns Performance widget provides a summary of recent campaigns, making it easy to review outcomes and trends. It supports the following customizations:
- Display 2, 5, or 10 campaigns at a time.
- Choose two specific metrics to compare side by side.
- Filter to show only active campaigns.
Ranking Performance Indicator (RPI)
The Campaigns Performance widget also includes the Ranking Performance Indicator (RPI) - a synthetic indicator that evaluates the overall effectiveness of your outbound campaigns. The RPI analyzes multiple parameters to produce a single performance score, helping you understand how effectively your campaigns reach the target audience and drive engagement.
Tabular view and export
Both the Channels Overview and Campaigns Performance charts can be switched to a tabular view. In the tabular view of Campaigns Performance, all available metrics for each campaign are displayed.
Data can be exported in CSV or XLSX format.