Campaign Monitoring - Track Outbound Campaign Performance in ConvyAI
Overview
After creating a campaign, you can monitor its progress in real time from the Campaign Lists page. Select a campaign to open its monitoring view.
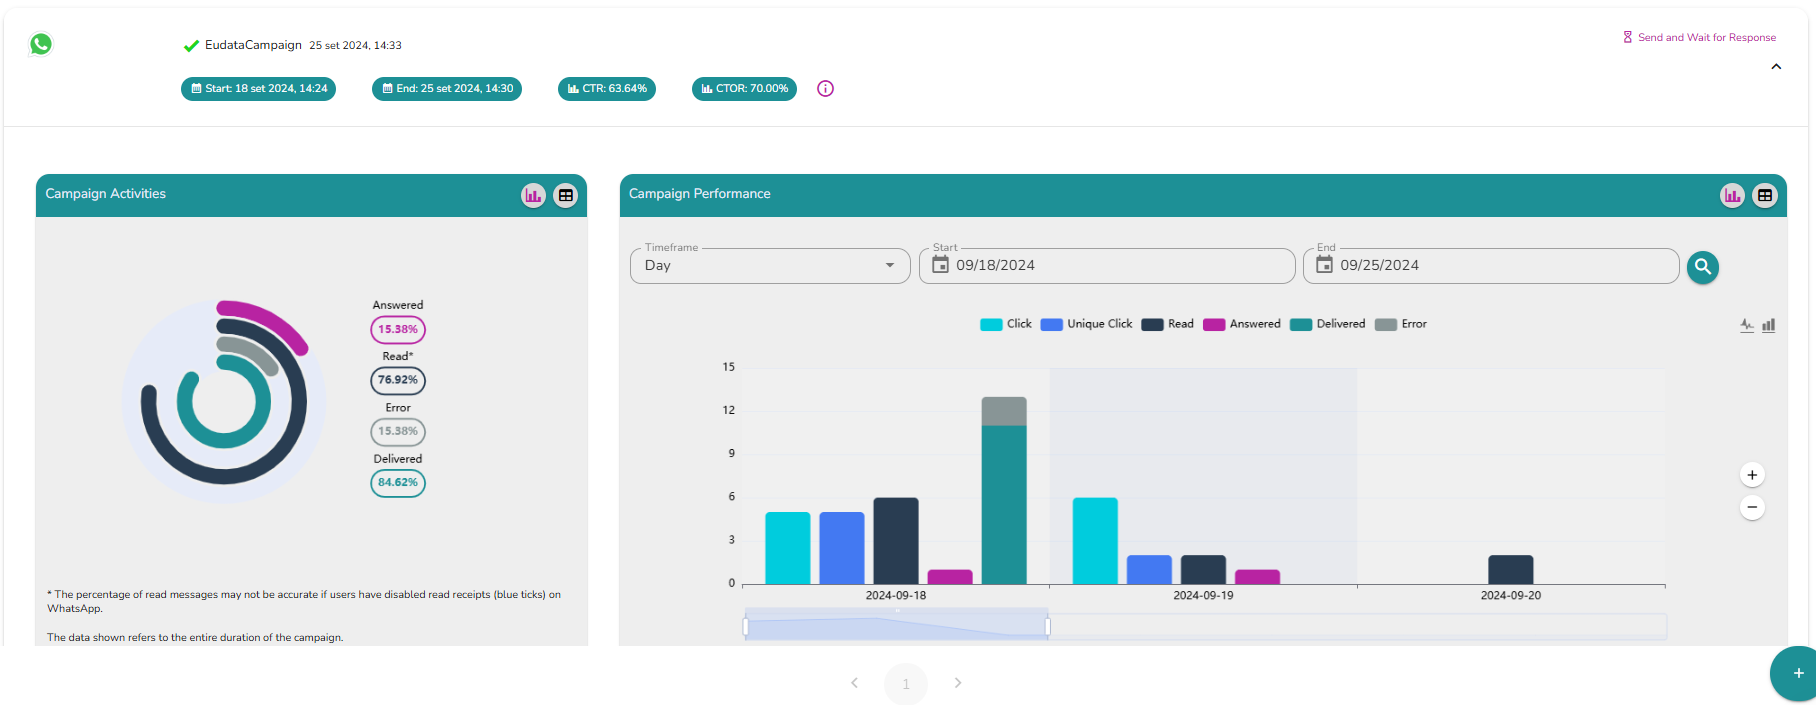
Campaign Activities
Displayed on the left, the Campaign Activities chart shows the percentage breakdown of messages by status:
| Status | Description |
|---|---|
| Delivered | Messages successfully delivered to recipients via WhatsApp. |
| Read | Messages opened and read by recipients. |
| Answered | Replies received from campaign recipients. |
| Error | Messages that could not be delivered due to technical issues - for example, an invalid phone number or a recipient without a WhatsApp account. |
The chart can be viewed as a graph or a table.
Campaign Performance
Displayed on the right, the Campaign Performance chart tracks the following metrics over time:
| Metric | Description |
|---|---|
| Clicks | Total number of clicks on links included in the campaign message. |
| Unique Clicks | Number of distinct recipients who clicked at least one link in the campaign message. |
| Delivered | Messages successfully delivered to recipients. |
| Read | Messages opened and read by recipients. |
| Answered | Replies received from campaign recipients. |
| Error | Messages that could not be delivered due to technical issues. |
You can switch between:
- Day by day view
- Hour by hour view
The chart can also be viewed as a table.
Both tables can be exported as CSV or XLSX files.