AVA Dashboard - Monitor Concurrent Access and Usage Trends in ConvyAI
Overview
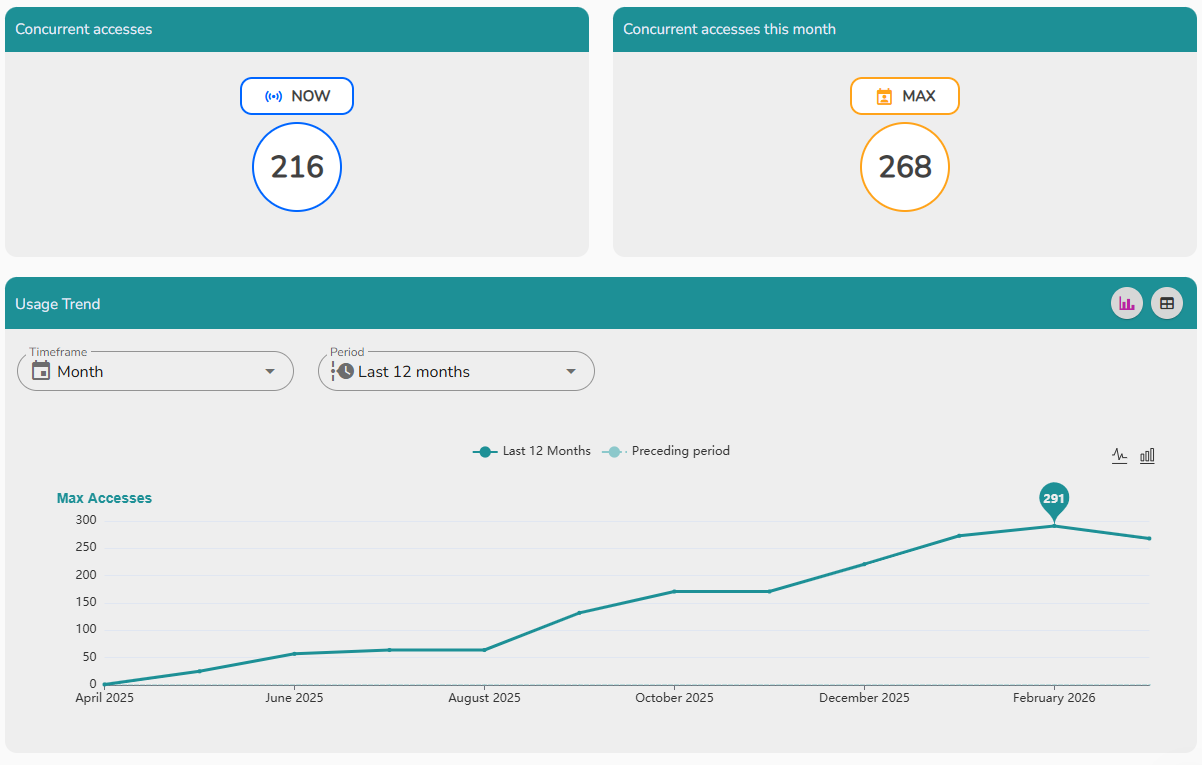
The AVA Dashboard provides real-time and historical visibility into how AVA is being used within your organization. It contains three charts covering active connections, monthly peaks, and usage trends over time.
Navigate to AVA → Dashboard.
Concurrent access
The concurrent access chart shows how many active connections are currently open on AVA at any given moment. Use this to understand real-time load and identify peak usage windows.
Monthly concurrent access
The monthly concurrent access chart displays the maximum number of active connections recorded during the current month. This is useful for capacity planning and tracking adoption growth over time.
Usability trend
The usability trend chart tracks engagement and activity patterns over a selected period. It can be displayed as:
- A graph - for a visual representation of the trend over time.
- A table - for a detailed, row-by-row breakdown of the data.
Use the time frame and period filters to focus on a specific date range.